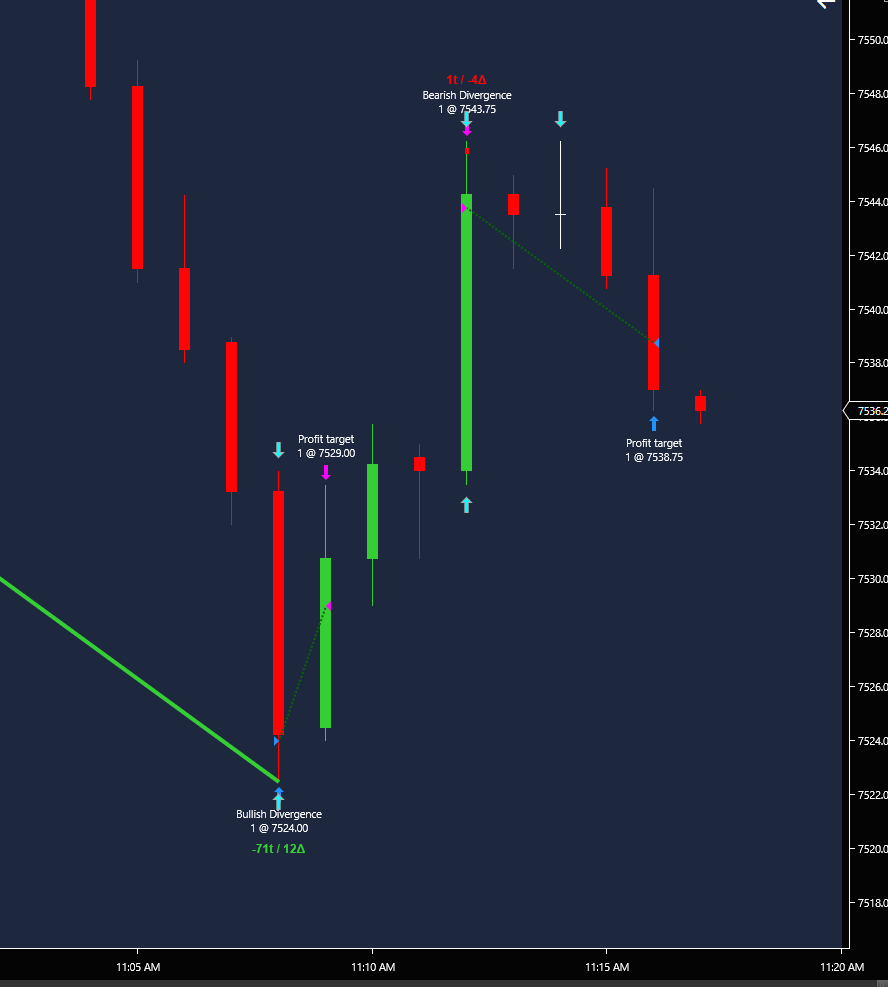
Understanding the Visual Cues
The AutoTrader tracks real-time Cumulative Volume Delta (CVD) against structural price swings, reading raw aggressive buying and selling volume to instantly spot institutional absorption.
IMPORTANT: Tick Replay Requirement
Because this tool accurately rebuilds the order flow from historical ticks, your NinjaTrader Data Series must have "Tick Replay" enabled for the AutoTrader to function correctly.
The Divergence Lines
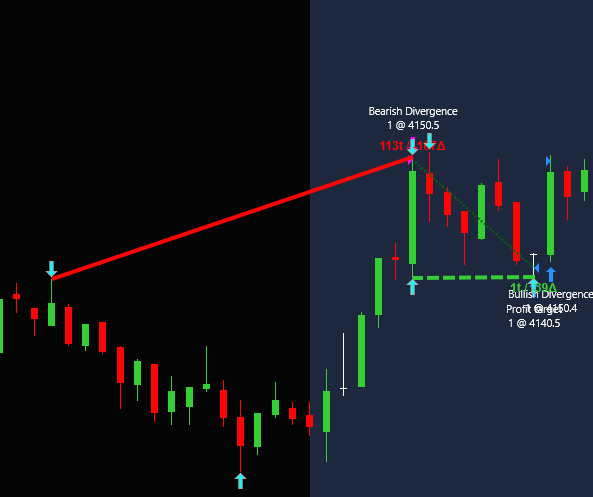
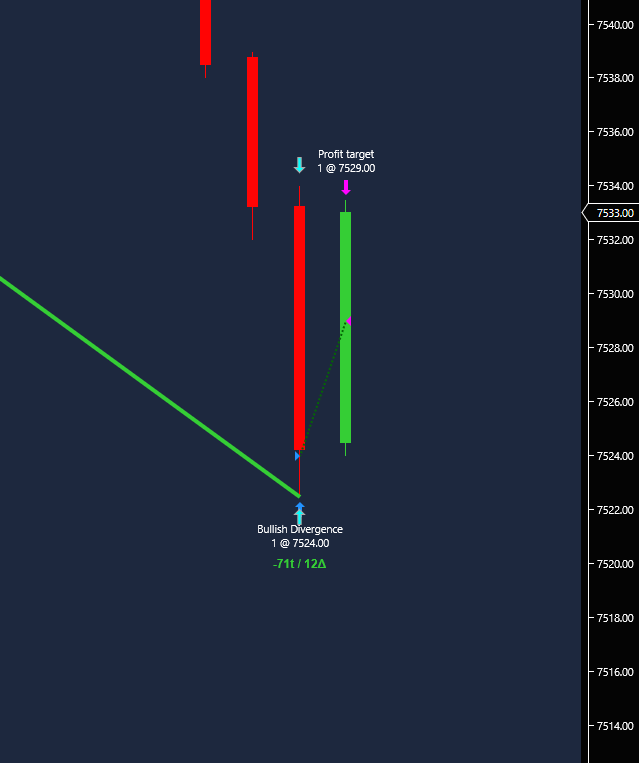
- Green Solid Line: Regular Bullish Divergence. Price made a Lower Low, but CVD made a Higher Low. Sellers are exhausted.
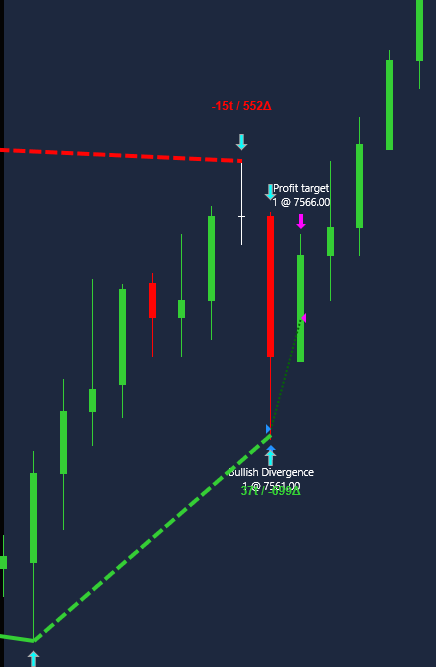
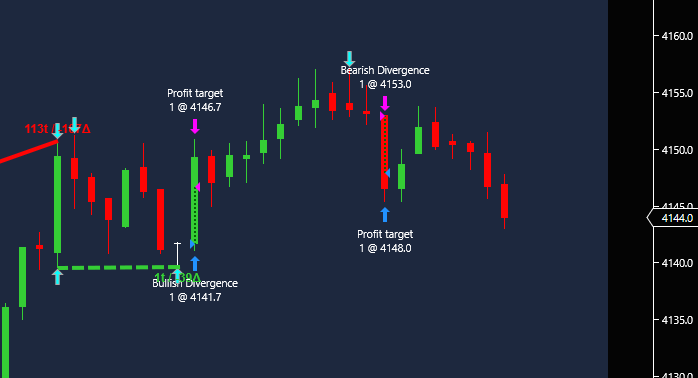
- Green Dashed Line: Hidden Bullish Divergence. Price made a Higher Low, but CVD made a Lower Low. Sellers attacked aggressively, but institutional buyers absorbed everything and held the price up.
- Red Solid Line: Regular Bearish Divergence. Price made a Higher High, but CVD made a Lower High. Buyers are exhausted.
- Red Dashed Line: Hidden Bearish Divergence. Price made a Lower High, but CVD made a Higher High. Buyers tried to push, but heavy institutional selling absorbed the volume.
The Chart Prints (e.g., "-52t / 1499Δ")
Above or below the divergence lines, you will see a text print measuring the exact difference between the two swing pivots.
- Ticks ("t"): The exact price difference between the two pivot points, measured in ticks. (e.g.,
-52t means the second pivot was 52 ticks lower than the first).
- Delta ("Δ"): The exact difference in Cumulative Volume Delta between the two pivots. (e.g.,
1499Δ means the aggressive buying was +1499 higher at the second pivot).