Spot Exhausted Moves Before They Turn — Then Trade Them with VWAP.
Most of the time, price and momentum travel together. The moments worth trading are when that relationship breaks. Built natively for NinjaTrader 8, TDD MACD Divergence automatically detects momentum exhaustion, draws swing lines on both price and MACD panels, and prints non-repainting entry signals the moment they confirm.
Watch step-by-step masterclasses and live trade execution breakdowns using non-repainting momentum exhaustion.
Discover the mathematics of false momentum signals, why standard MACD repainting burns traders, and how anchoring divergence to VWAP standard deviation bands creates high-probability trade setups.
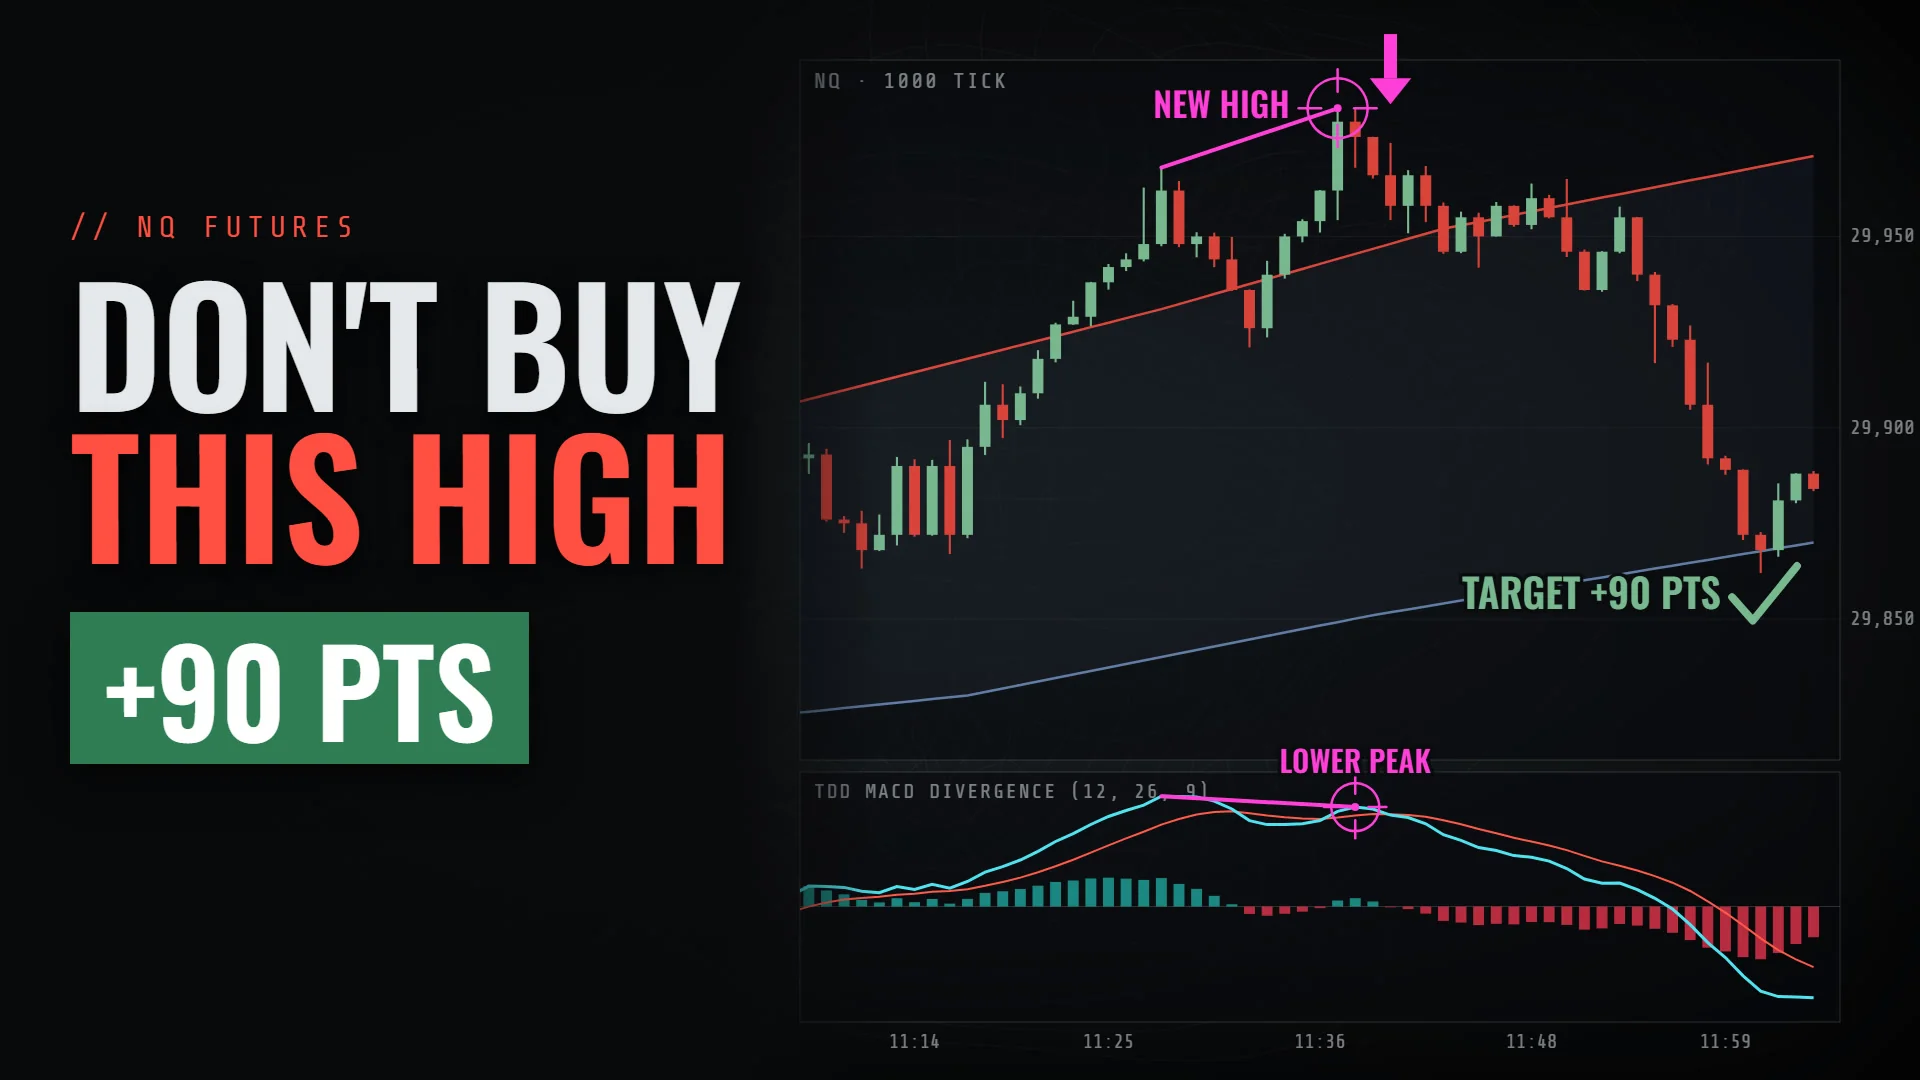
Watch a real live execution on NQ: identifying the "Don't Buy This High" momentum trap at the +2.0 VWAP band for an immediate, aggressive +90 point short retrace straight to VWAP.
Discover how objective momentum divergence alerts you to market reversals before they break out, filtering out false signals with institutional VWAP confirmation.
Why trading divergence by eye leaves retail traders stranded — and how algorithmic precision changes the game.
Every feature built to remove hesitation and provide actionable clarity on NinjaTrader 8.
Detects both bullish divergence (price lower low, MACD higher low) and bearish divergence (price higher high, MACD lower high) with mathematical precision.
A divergence is confirmed at the close of the bar where MACD crosses back over its Avg. This deliberate design ensures you never trade on "phantom" signals that vanish three bars later.
Keep it On to enforce classical capitulation (momentum extremes far past zero). Turn it Off to capture counter-trend rallies and bear flag pullbacks below zero in strong trends.
Capture double bottoms and double tops. Setting Price Tolerance (in ticks) lets the second price swing sit slightly short of equal extremes while still qualifying as genuine divergence.
Replaces your default MACD entirely. Features Fast EMA (12), Slow EMA (26), Signal EMA (9), zero line, and a crisp two-color histogram (Teal above Avg, Crimson below Avg).
Strategy developers can read the indicator's exposed public Signal series directly: +1 on bullish bar close, -1 on bearish bar close, and 0 otherwise.
A divergence tells you momentum is fading. It does not tell you where that is happening or how far price might travel. VWAP answers both questions.
The premier mean reversion setup. Price pushes beyond the ±1 or ±2 Standard Deviation VWAP bands, reaching statistical extreme stretch.
On a trending session, price respects VWAP as dynamic support or resistance. Counter-trend pullbacks into VWAP display exhaustion right as they terminate.
For conservative traders fading heavy trend days. Rather than entering at the arrow, wait for institutional buyers to prove they can reclaim fair value.
| Where Divergence Forms | Bullish Divergence | Bearish Divergence | Grade |
|---|---|---|---|
| At or beyond ±1 / ±2 SD Band (Stretched) | At lower band: Long back toward VWAP | At upper band: Short back toward VWAP | A+ |
| Pullback into VWAP with Session Trend | Price above VWAP all day, dips to VWAP: Long | Price below VWAP all day, rallies to VWAP: Short | A |
| At Major Institutional Level (Prior Day H/L, Overnight H/L) | Long at confirmed level support | Short at confirmed level resistance | A / B |
| Mid-range chop (No level nearby) | Lower conviction / Reduce size | Lower conviction / Reduce size | C |
| Fading a violent runaway trend day | Wait for full VWAP reclaim first | Wait for full VWAP loss first | AVOID |
Inspect real-world setups demonstrating precise entry triggers, stop locations, and profit targets.
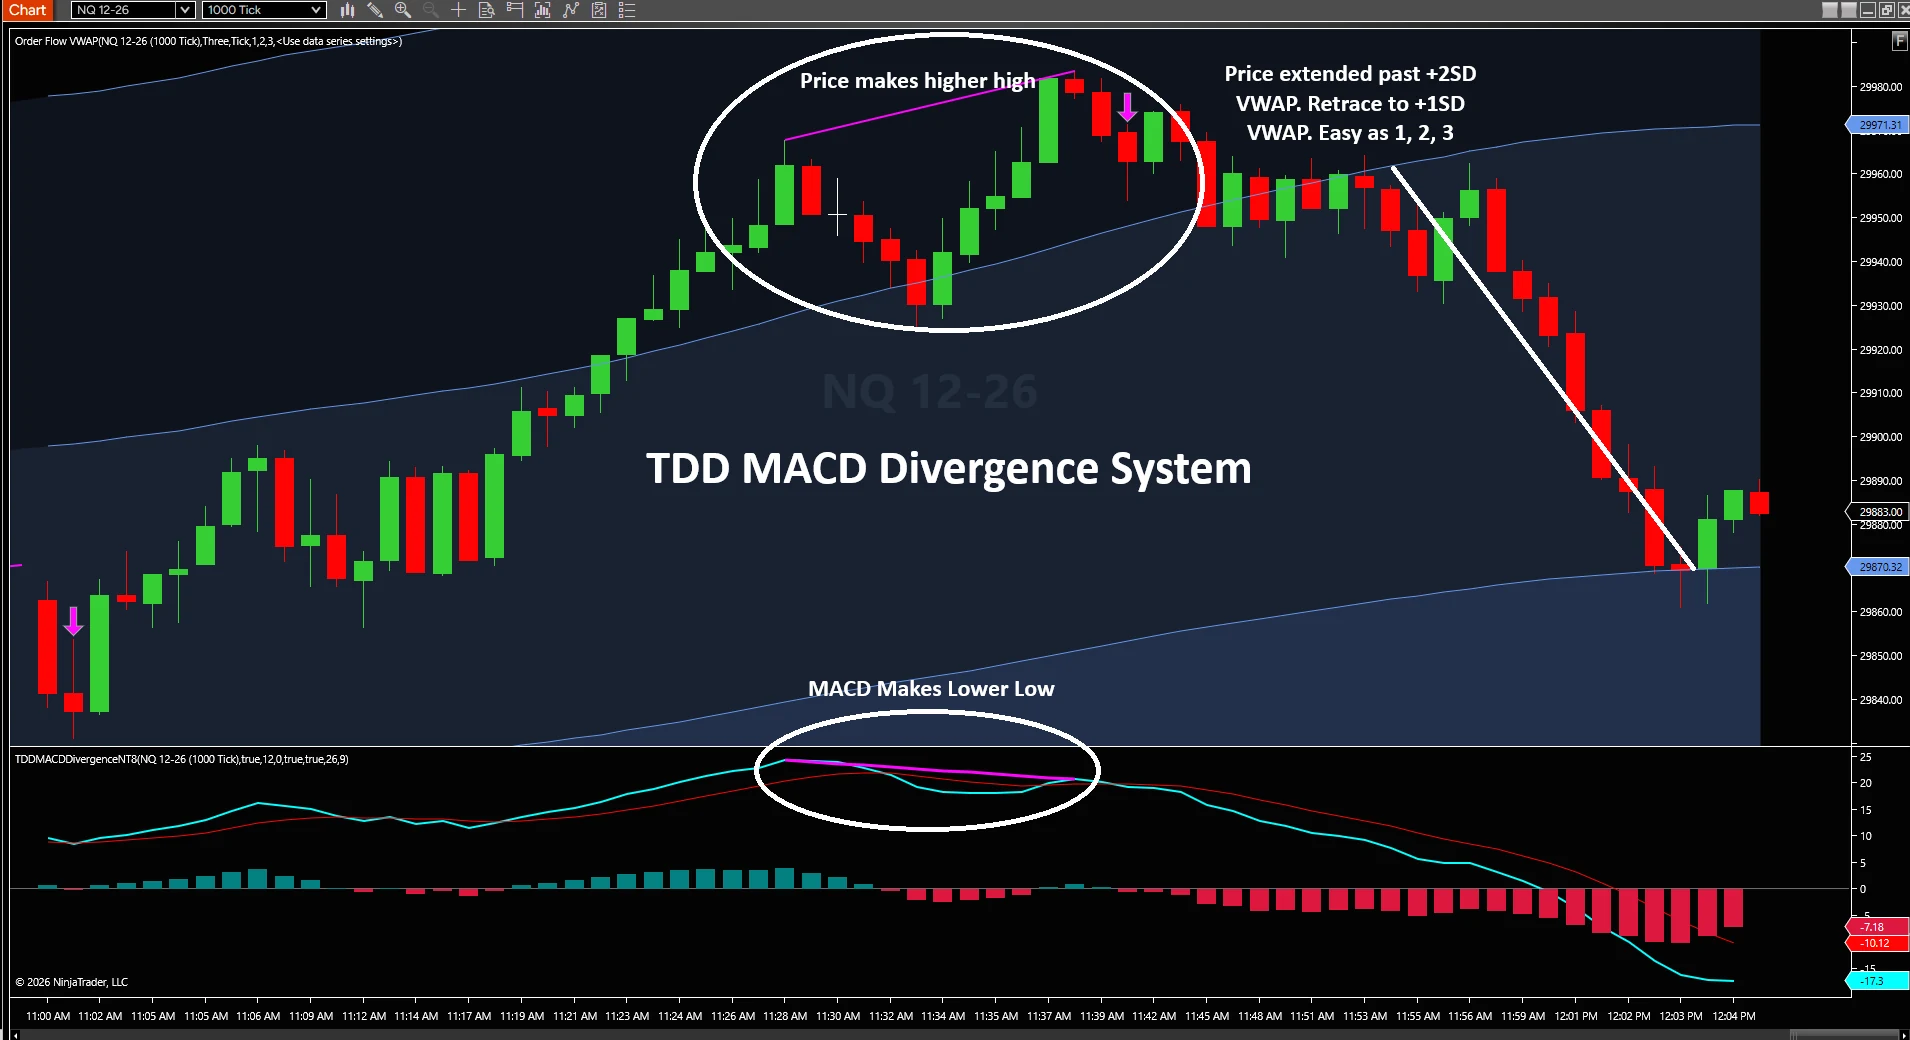
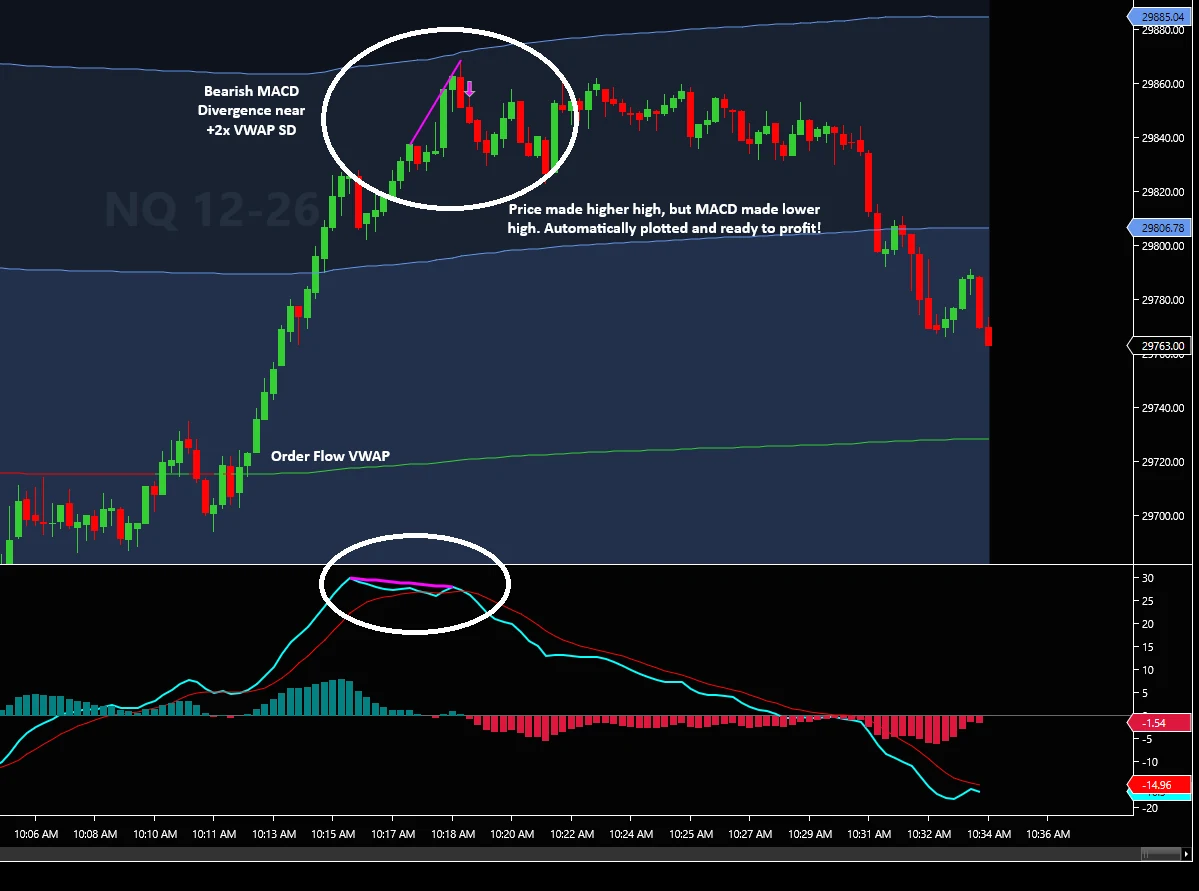
In this textbook example on NQ, price aggressively drives upward past the +2 SD VWAP band, creating an overextended market profile. While price prints a higher high, the MACD indicator prints a substantially lower peak—mathematically signaling buyer exhaustion.
When price is trading above the second standard deviation band, it is in the top 2.5% of statistical extension for the session. Entering long here is statistically reckless; looking for exhaustion is where institutional asymmetric reward lives.
Notice how cleanly the indicator maps both price peaks and MACD highs. The arrow marks the exact bar where MACD crossed back below its Avg—locking in the divergence with zero repainting.
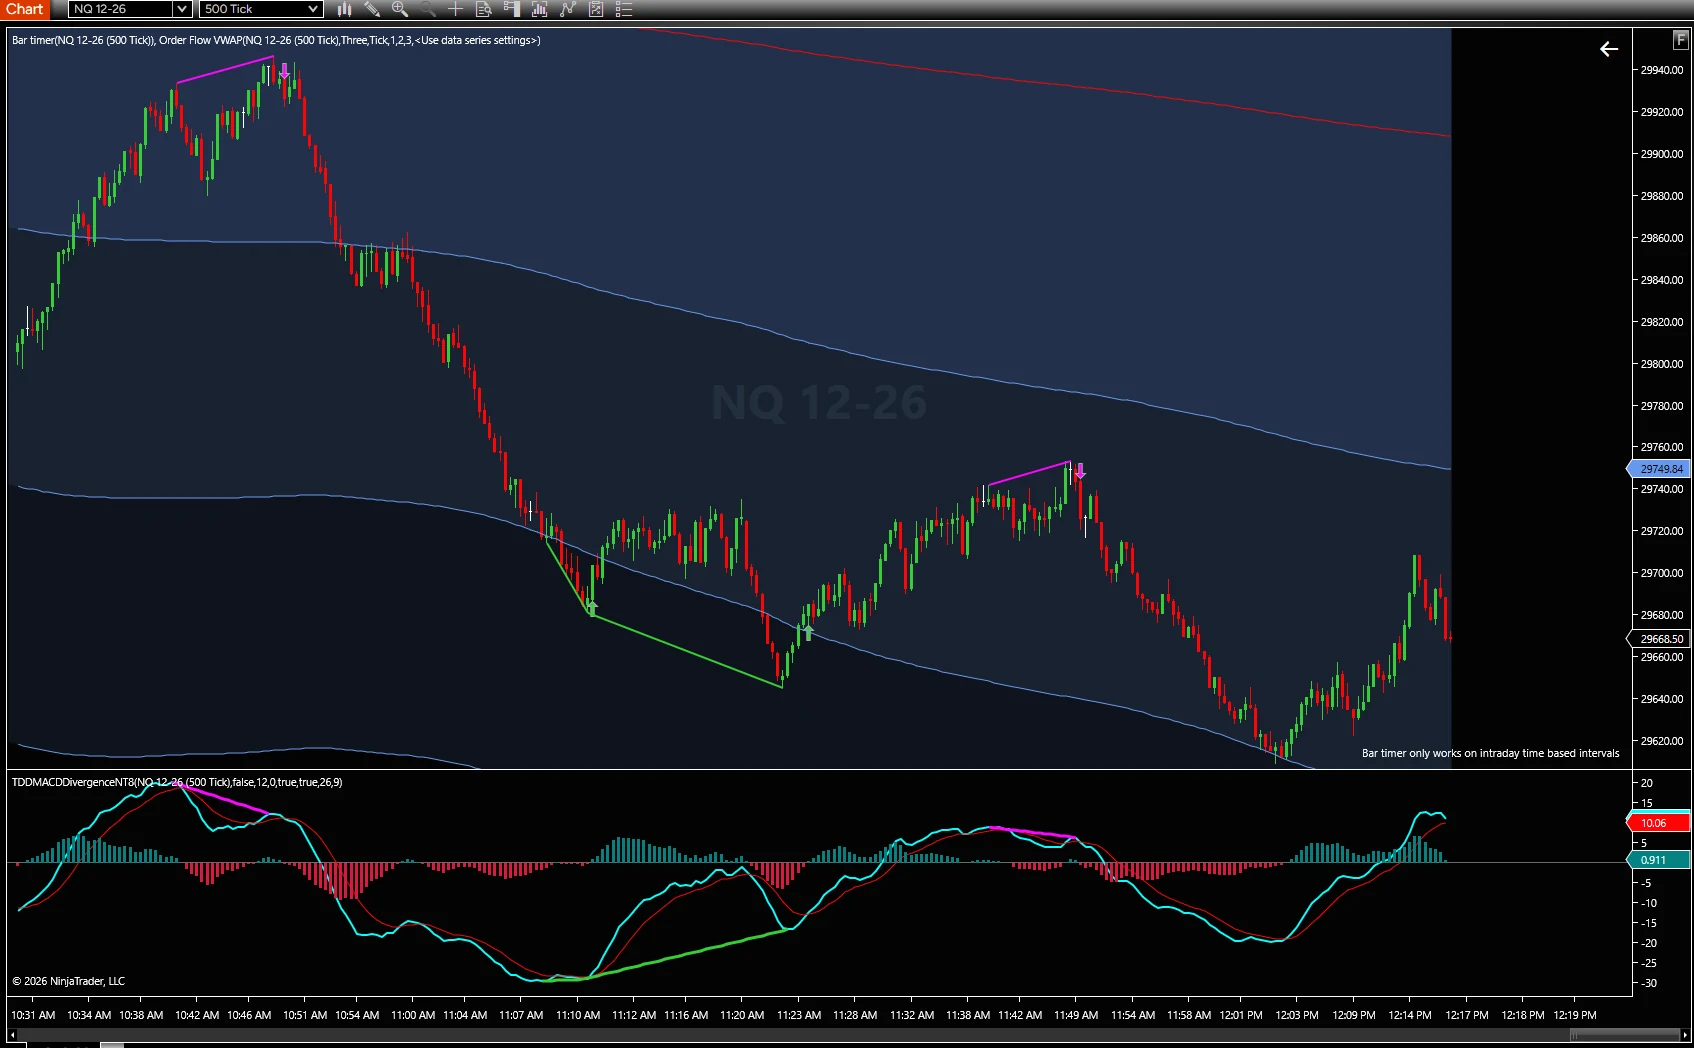
Tick charts compress noise during slow markets and expand resolution during high-volume pushes. In this NQ 500-tick chart, TDD MACD Divergence demonstrates both directions of the playbook in a single session:
On a historical chart, connected divergence lines look like they were known at the exact price wick. But real-time trading requires honesty: the divergence is only confirmed once MACD crosses back over its Avg.
The arrow prints on that exact confirmation bar. By waiting for the confirmation cross, you eliminate the risk of price dragging MACD into a new extreme and wiping out the setup. You enter with defined risk and an objective thesis every single time.
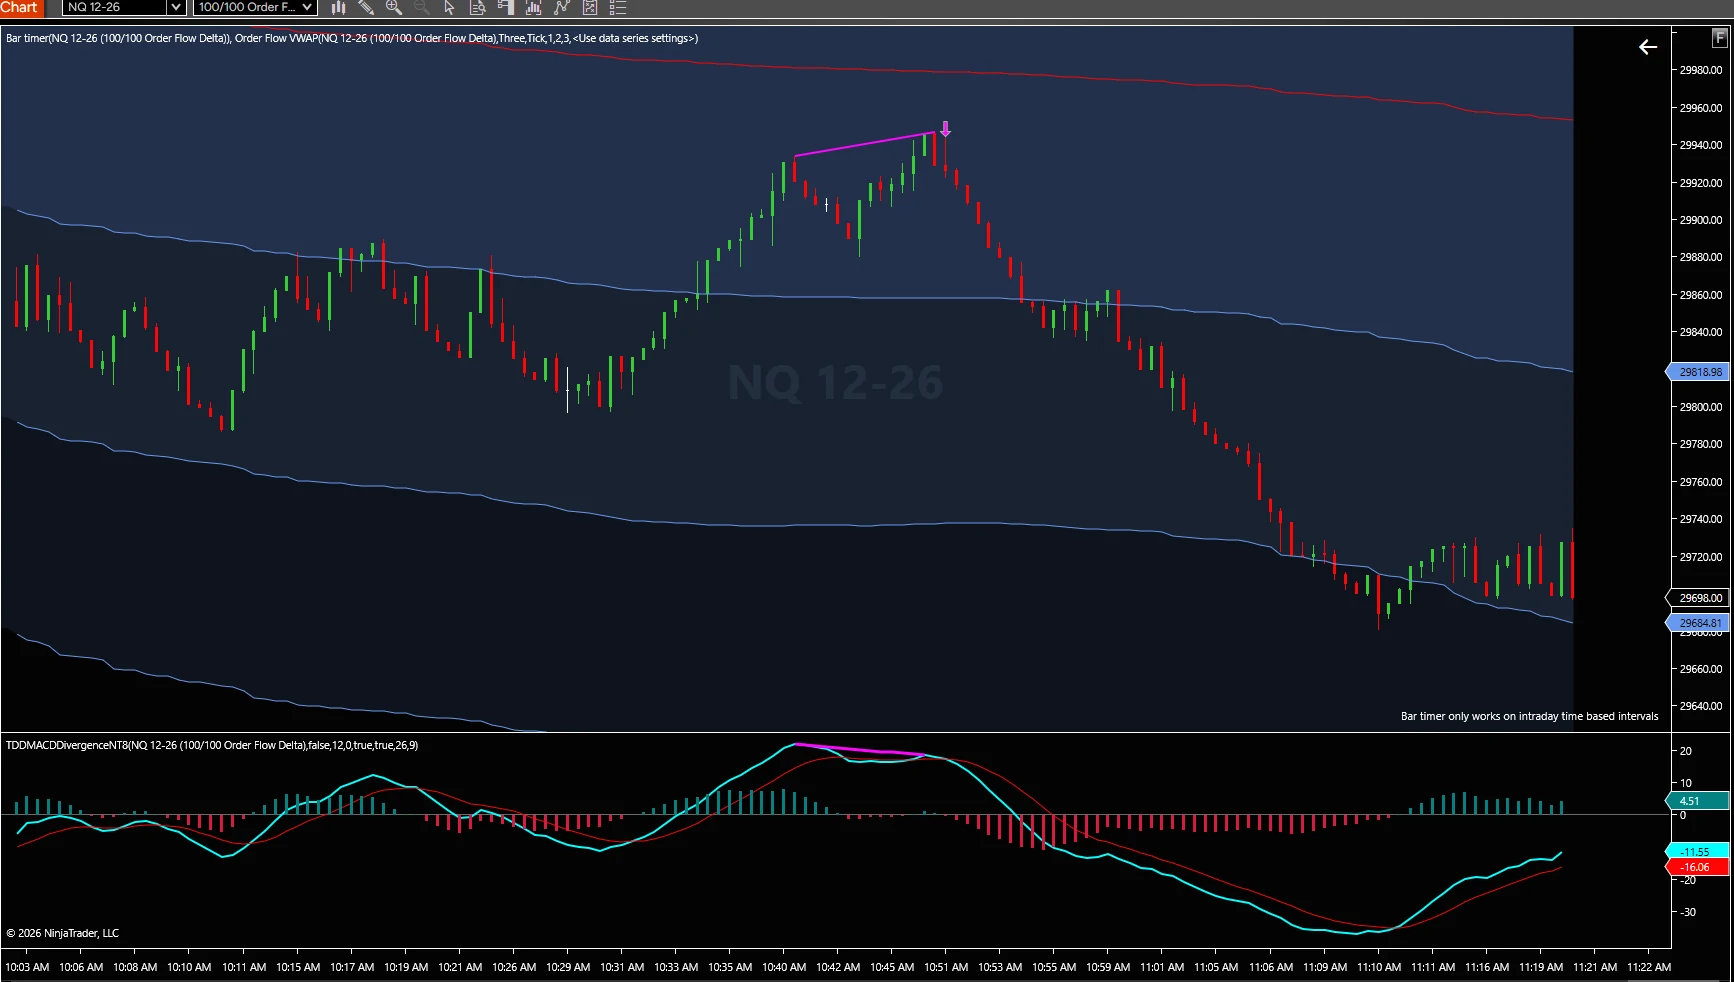
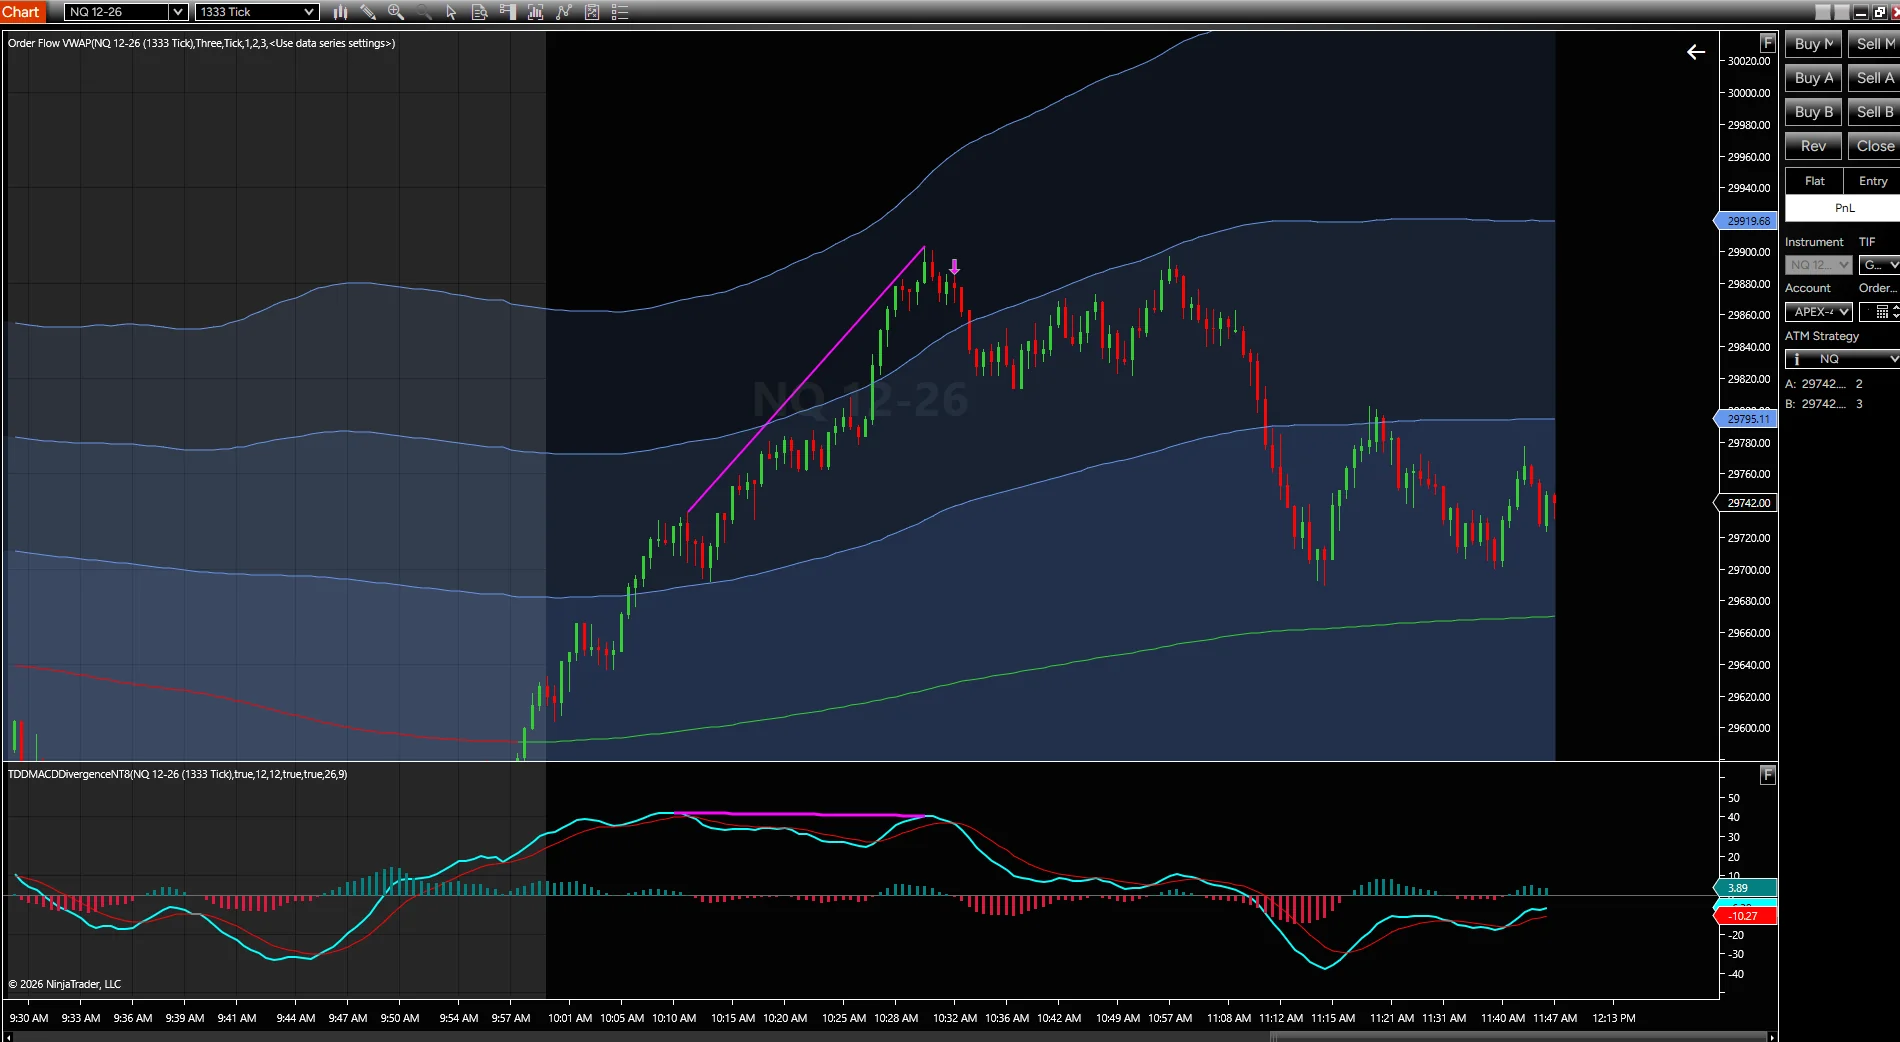
Higher tick intervals like the 1333-Tick aggregate large volume blocks, filtering out micro-noise while preserving critical structural turning points. In this live NQ session, price pressed cleanly above 29,900 into the upper standard deviation band with fading momentum.
While price pushed to new highs, the TDD MACD Divergence plotted a distinct descending peak structure on the indicator panel. The moment MACD crossed back below its average, the downward arrow triggered with tight risk, delivering an aggressive multi-hundred tick descent directly into institutional VWAP value.
Access non-repainting signals directly in your custom NinjaScript strategies.
The indicator exposes a native Signal series: +1 on the bar a bullish divergence confirms, -1 on the bar a bearish divergence confirms, and 0 on every other bar. Strategies running on Calculate = On bar close can automate entries and trailing stops with zero guesswork:
Every parameter is fully customizable to match your instrument, volatility, and trading style.
| Group | Parameter | Default | Functionality & Optimization |
|---|---|---|---|
| 01. MACD | Fast / Slow / Smooth | 12 / 26 / 9 |
Standard classic MACD parameters. Smooth controls the Avg line crosses that define legs. |
| 02. Divergence | Price Tolerance (ticks) | 0 |
Allows second price swing to fall a few ticks short of equal highs/lows, capturing double bottoms/tops. |
| 02. Divergence | Require Zero-Line Filter | On (True) |
When On, enforces classic exhaustion (lows below zero, highs above zero). Turn Off to spot sub-zero bearish pullbacks. |
| 02. Divergence | Show Bullish / Show Bearish | On / On |
Toggle either direction on or off based on your macro bias or strategy mandate. |
| 02. Divergence | Enable Alerts | On (True) |
Plays audio alert (Alert1.wav) and writes to NinjaTrader's Alerts Log in real time. |
| 03. Visuals | Bullish / Bearish Colors | Lime Green / Magenta |
Controls line and arrow colors on both the chart panel and lower MACD panel. |
| 03. Visuals | Histogram Up / Down | Teal / Crimson |
Two-color histogram reflecting MACD position relative to its Avg line. |
| Setup | Calculate | On bar close |
Keep this default. The leg and swing logic is mathematically built on completed bars. |
When you use this QuantVPS code you get 3 free indicators, a TDD CVD Divergence 2.0 AutoTrader Workspace, and 5 pre-loaded Strategy Templates to fit your trading style.
Claim 60% Off QuantVPSEquip your charts with objective, automated momentum divergence detection. Know exactly when trends are running out of fuel and trade them with institutional VWAP location.